
Case Study - Claims Dashboard/Visualization
Problem
A large transportation company’s auto liability losses increased 15% per year for four consecutive years. Its risk management team was asking for millions of dollars from senior management to support loss control and safety initiatives designed to decrease cost. The company had no clear method for identifying the root cause of loss or for measuring ROI of these safety initiatives.
RCS Action
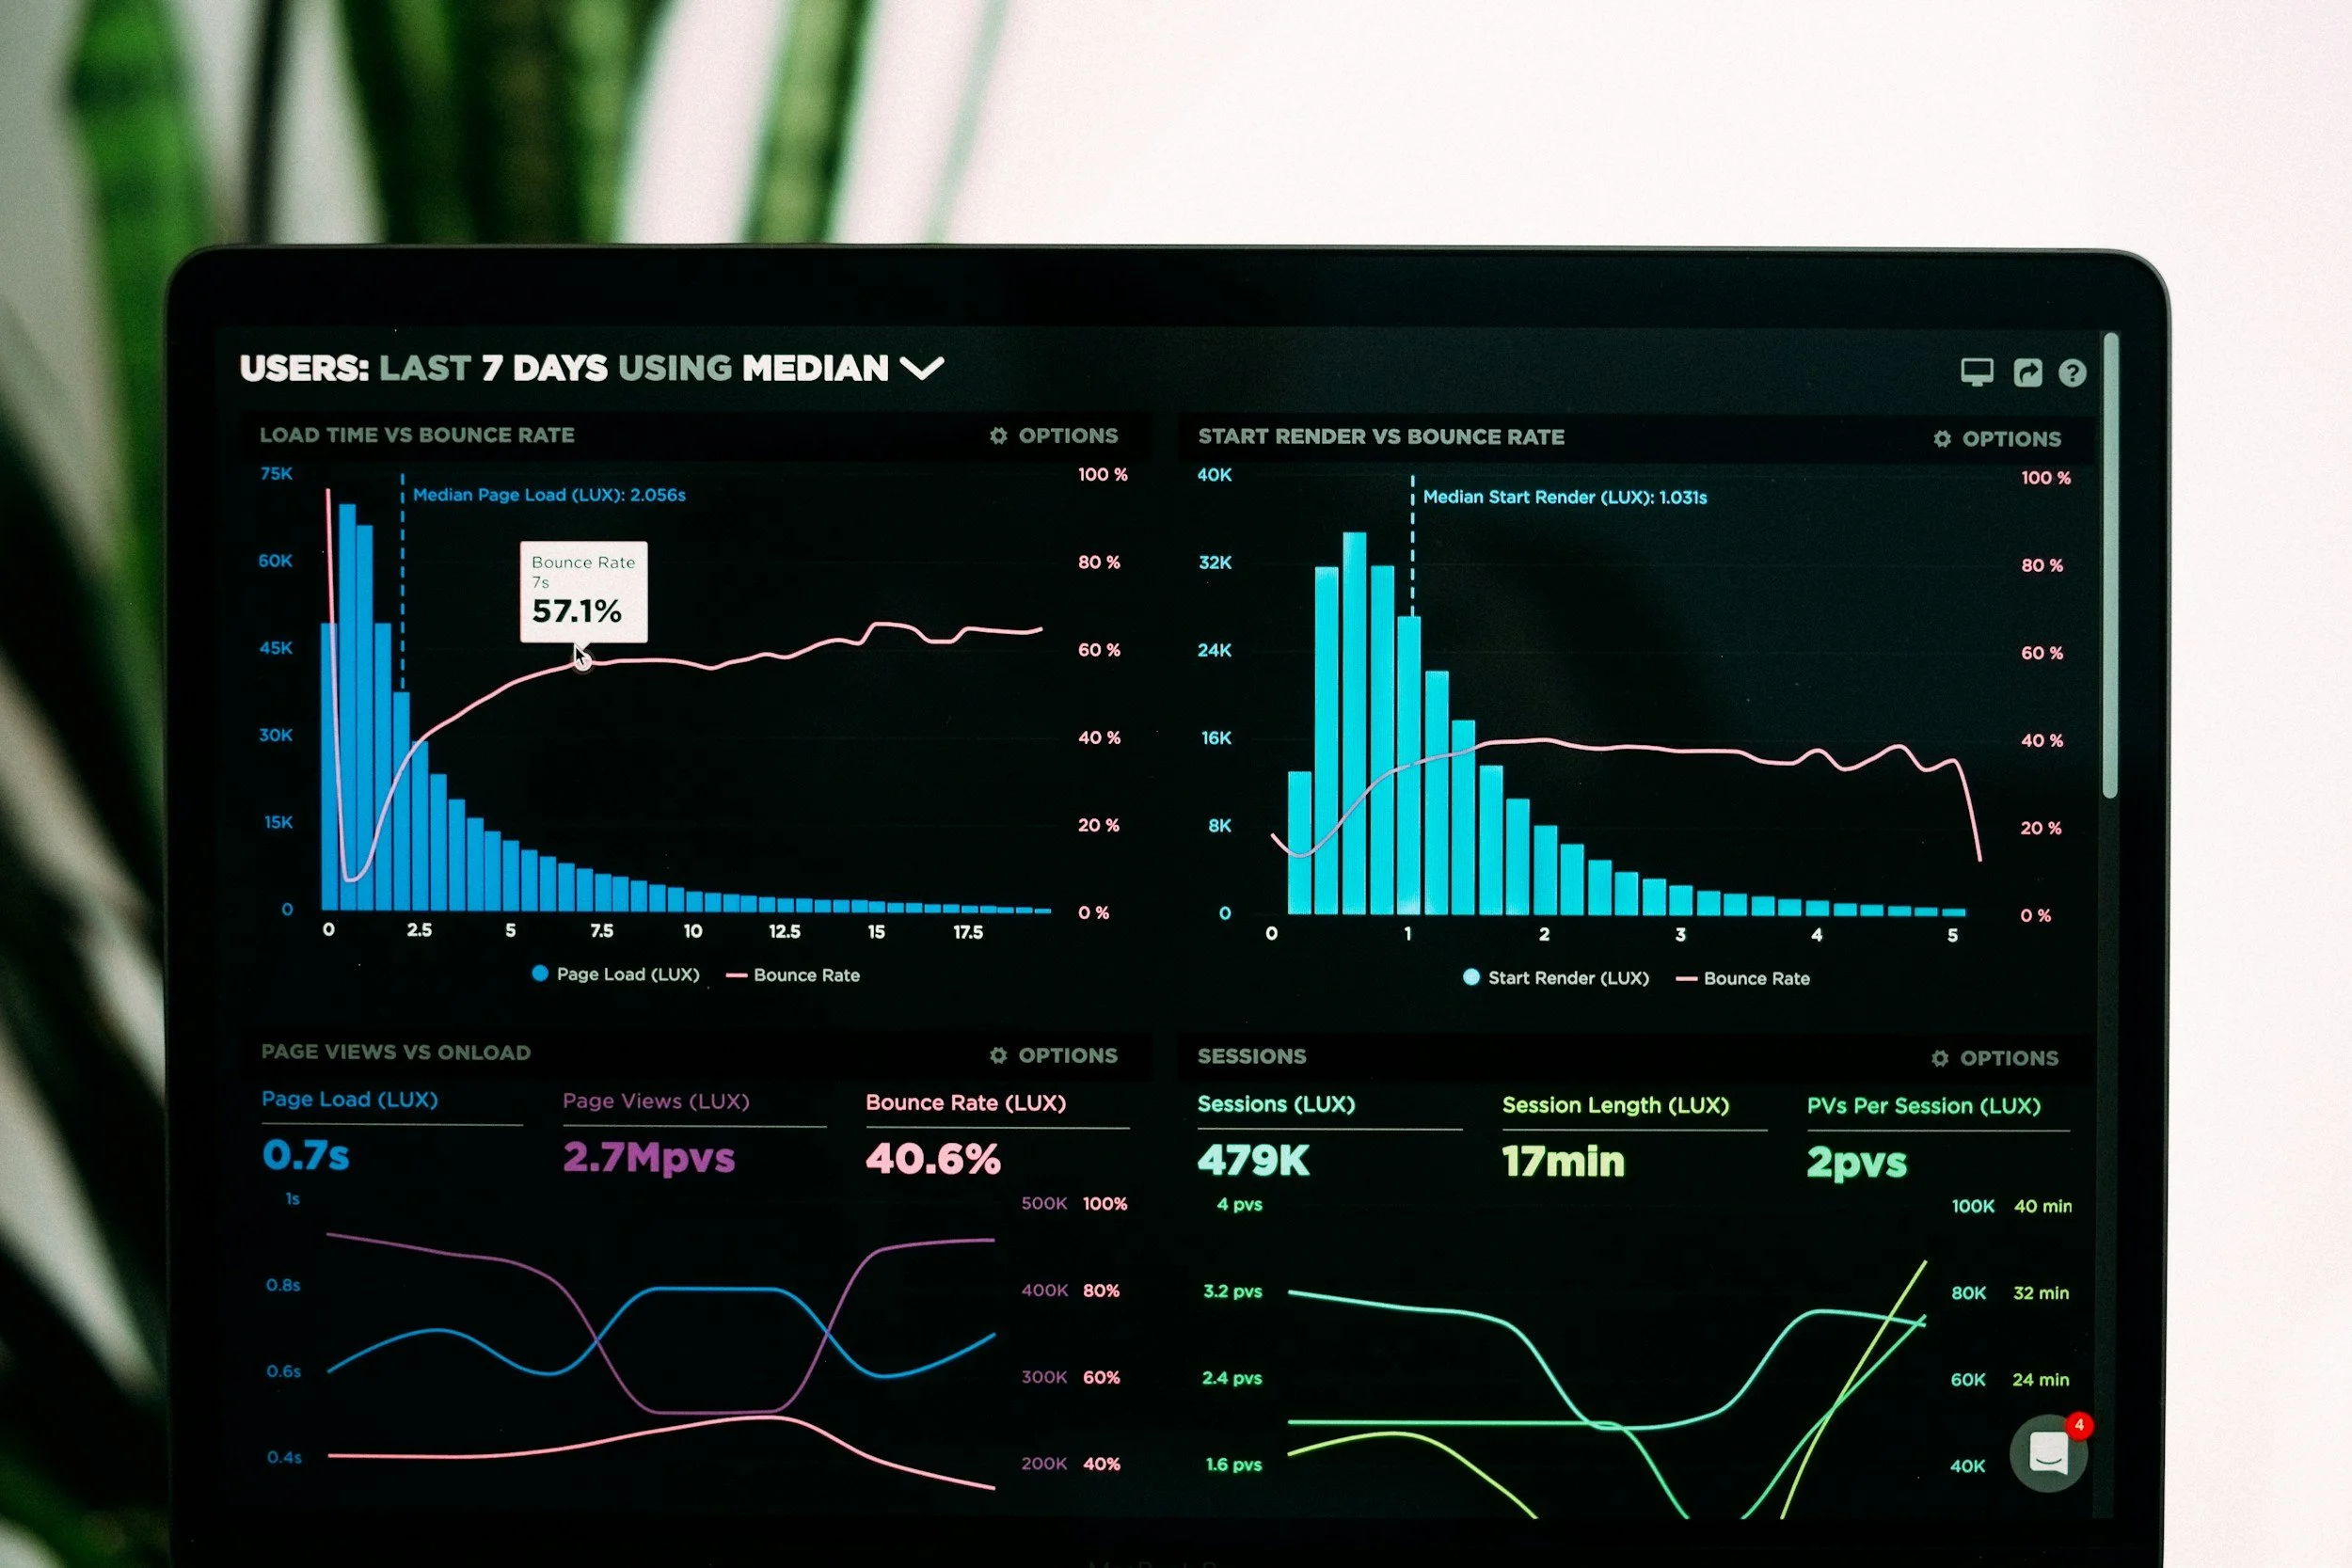
RCS’s team created a data visualization solution that tied the client’s 99,000 claim records to underlying exposure information, enabling the client to monitor claim activity down to the region level where safety pilots were being implemented. The solution also enabled the client to benchmark types of injuries through time, helping identify the root cause of loss.
Outcome
A year after the beginning of the project, the client received funding for a full roll-out of the programs that were previously piloted and tracked in the data visualization solution. The client closed the year by saying “we would recommend Adam and his team to other companies facing retained casualty insurance challenges.”